18. Debugging UDP Traffic

This is a quick tutorial on how to debug UDP broadcast traffic sent from our code to ForeFlight. This method applies for any type of UDP traffic you want to monitor, but the fact that it is sent in plain text makes it even easier.
Linux
If you happen to have a Linux box connected to the same network, you can use the built-in nc command to listen to a specific TCP or UDP port. For our ForeFlight data, we would do something like this:
nc -u -l 49002 -kWhere -u is for specifying UDP, -l to specify the port and the -k is to keep monitoring indefinitely (the default behavior stops printing the data after a few bytes are received).
You'll see all the traffic coming through like this:
XGPSHelloForeFlight,-69.4282,44.3234,3657.42,45.00,56.59
XGPSHelloForeFlight,-69.4232,44.3284,3657.42,45.00,56.59
XGPSHelloForeFlight,-69.4182,44.3334,3657.42,45.00,56.59
XGPSHelloForeFlight,-69.4132,44.3384,3657.42,45.00,56.59
XGPSHelloForeFlight,-69.4082,44.3434,3657.42,45.00,56.59
XGPSHelloForeFlight,-69.4032,44.3484,3657.42,45.00,56.59
XGPSHelloForeFlight,-69.3982,44.3534,3657.42,45.00,56.59
XGPSHelloForeFlight,-69.3932,44.3584,3657.42,45.00,56.59
Microsoft Windows
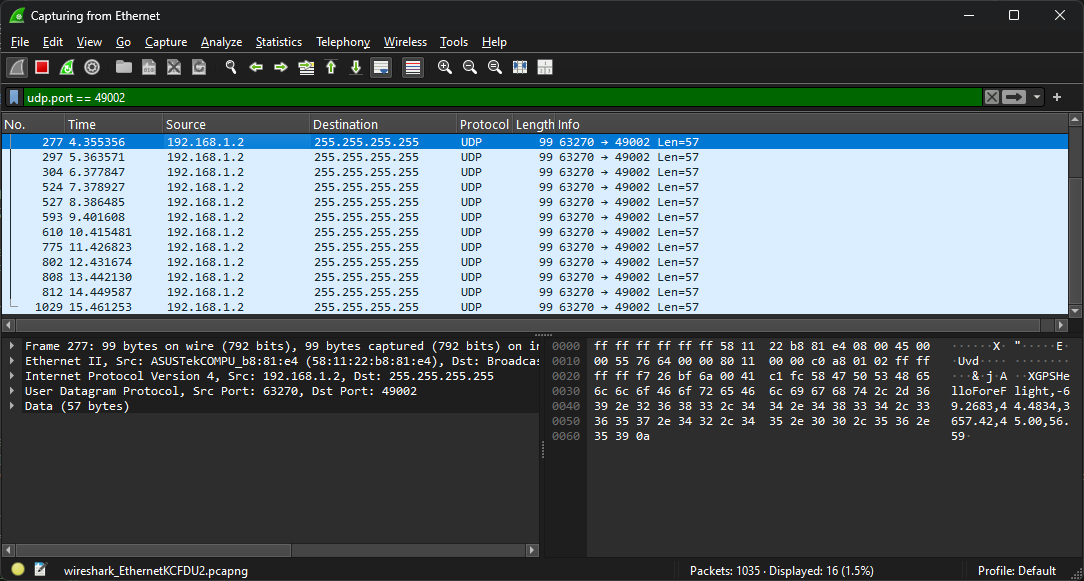
For Windows, you can use a tool called Wireshark and create a udp filter. Note that you might need to install the WinPcap if you don't already have it installed. The filter should look like this:
udp.port == 49002
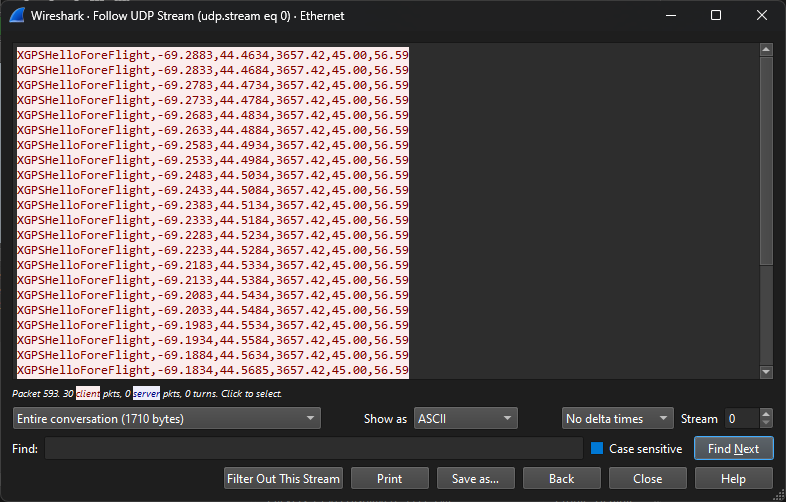
You'll see output like this, which you can right click on any packet and click on Follow->UDP Stream to see it in a nicer way:


Mobile
There are many apps that can do something similar, both on iOS and Android, both free and paid so try out a few to see which one you like 😄
